We've Rebuilt Help Center Analytics From the Ground Up. Here's What's New.
We've rebuilt HelpCenter.io analytics from the ground up. Follow every visitor from search to answer, measure your self-service resolution rate, surface insights in seconds, and finally understand how your help center is really performing.
There are some releases that add a nice feature. And then there are the ones that completely change how you use your help center every day.
This is one of those releases.
We've rebuilt HelpCenter.io analytics from the ground up. The entire experience has been redesigned to help you find answers faster, surface meaningful insights in seconds, and finally understand how people move through your help center from their very first search to the moment they find an answer.
For the first time, you can follow every visitor's journey, measure your self-service resolution rate, and get a dashboard that doesn't just show numbers. It points you toward the next improvement that will make the biggest difference for your customers.
I'm genuinely excited about this release. Not just because it introduces new reports, but because I think analytics has finally become one of the most useful parts of HelpCenter.io. The way it was always meant to be.
Let me show you how.
Meet visitor journeys
Open your stats and you'll find a new section called Journeys. This is the heart of the update.
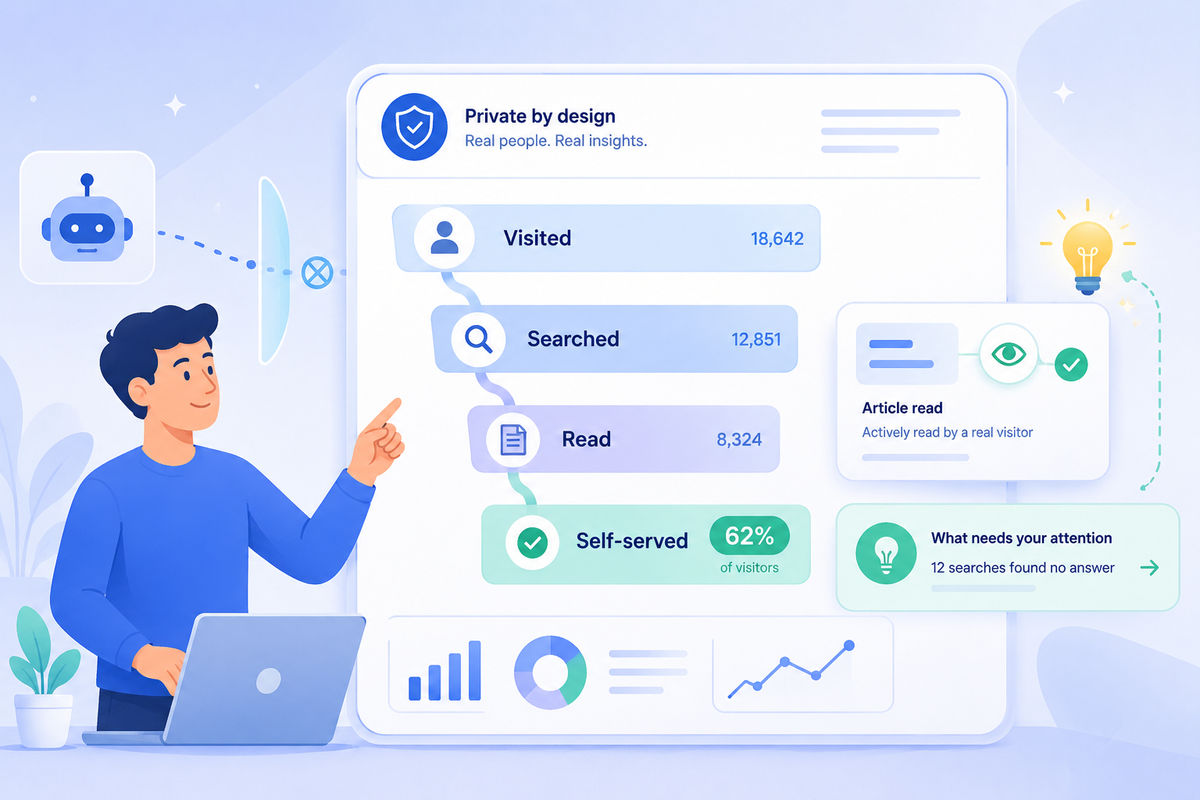
At the top sits the number that would make the biggest difference in helping you understand the performance of your help center: the share of visitors who resolved things on their own before ever reaching your team. Your dashboard now states it plainly, something like "62% of visitors resolved on their own before reaching your team, while 9% went on to contact support." That one line is your self-service health in a sentence.
Below it is the visitor outcome funnel. It walks through the stages every visitor moves through, and shows you both the count and the percentage at each one:
- Visited the help center
- Searched for something
- Read an article
- Self-served (found the answer and left, no ticket)
- Contacted support
Watching the drop-off between stages is where the insight lives. If lots of people search but few go on to read an article, your search results aren't surfacing the right content. If plenty read an article but still contact support, the article looks like the answer without actually being it. You can finally see exactly where your help center is winning and where it's quietly leaking people to your support queue.
You also get a few numbers that used to be impossible to know: the average number of steps someone takes before they self-serve, the average before they give up and contact you, the percentage of visitors who start with search versus browsing, and your bounce rate.
See the actual path a single visitor took
Totals are great for the big picture. Sometimes you need to watch one real journey unfold.
So the Journeys section also lists individual sessions, and you can expand any one of them into a step-by-step timeline. You'll see the path play out: landed on the home page, searched "how do I cancel," opened your cancellation article, rated it helpful, left. Each session is tagged with its outcome (self-served, contacted, or abandoned), how long it took, and how many steps it ran.
If your visitors move between surfaces, say they start in the public help center and finish in the in-widget search on your site, the path shows that hop too.
This is the part that turns a number into a decision. When you can see five people in a row search the same phrase, open the same article, and still contact support, you don't need a meeting to know which article to rewrite first.
A dashboard that tells you what to do next
While we were in there, we rebuilt the whole stats page around a cleaner, more modern layout, and gave it a brain.
Up top, your key numbers sit together at a glance: visitors, searches, article views, average reading time, views per visitor, and your satisfaction score. Each one shows how it moved compared to the previous period, so a dip or a jump is obvious without you doing the math.
One metric I'm especially happy to finally bring to HelpCenter.io is average reading time. It's something many of you have asked for over the years, and it gives you another way to understand how people engage with your content. A quick glance tells you whether visitors are genuinely spending time with an article or bouncing almost immediately, making it much easier to spot guides that deserve another look.
Then there's my favorite addition, a panel called "What needs your attention." Instead of making you go digging, your dashboard now scans your data and surfaces the handful of things actually worth acting on, ranked by urgency. For example:
- "47 searches found no answer. Visitors searched for "export to csv," "sso setup," and more without finding a matching article. Writing one closes the gap." It even links you straight to the failed-search list.
- "'Setting up your account' is underperforming. 38% of readers marked it unhelpful across 1,200 views. A rewrite could lift your overall score."
- "'Getting started guide' is your top performer. 4,300 views with 91% positive feedback. Link to it from related articles to spread the win."
Each insight comes with a one-click way to go fix it. It's the difference between a dashboard that reports the weather and one that hands you an umbrella.
Numbers you can finally trust
Here's the honest part, and the reason your dashboard might have sent you to this page.
When you move to the new analytics, some of your numbers will look lower than they did before. That's expected, and it's a good thing. We didn't lose your traffic. We stopped counting things that were never really there.
Two changes drive it. First, bots. The old system couldn't reliably tell an automated crawler apart from a real person, so a lot of bot and scraper traffic got counted as visitors. The new system filters that out by default, so your visitor count now reflects actual humans. Second, article reads. The old system counted a view the instant a page loaded, even if someone bounced in half a second. Now an article only counts as read when the content is genuinely on screen and a real person is there with it. Search tracking got cleaner too, with duplicate and junk queries stripped out, so the searches you see are real questions from real people.
So yes, the totals are smaller. But every visitor is a person, every read is a read, and every metric we just walked through, your self-service rate, your funnel, your insights, is built on numbers you can actually stand behind. Lower and true beats higher and fiction every time.
Private by design
We also took the rebuild as a chance to collect less.
The new analytics doesn't set tracking cookies on your visitors, never stores anyone's raw IP address, and doesn't collect names, emails, or phone numbers from the people browsing your help center. None of it gets handed off to Google, Facebook, or any third-party ad network. Your visitors' data stays on HelpCenter.io's own infrastructure.
What it does keep is the minimum needed to give you the report: that a visit happened, what was searched, which article was read, and roughly how long. Enough to tell you what's working. Not enough to identify the person doing it. Your visitors get a help center that respects them, and you get analytics you can feel good about running.
What this means for you
Nothing for you to switch on. The new analytics, the journey view, and the insights panel are part of your help center, and we're rolling them out across accounts in waves. If your dashboard already shows them, you're on the new system. If not, they're on the way.
The one thing to expect is the number reset we covered above. It's a one-time shift in what gets counted, not a drop in your real traffic, so don't compare old screenshots one-to-one against the new figures.
Go open your Journeys section and find your self-service resolution rate. I think it'll be the most useful number you've looked at all quarter. And if anything seems off beyond the expected reset, reach out via live chat or email. We're watching the rollout closely and we'd genuinely like to hear how it lands.
FAQ
What is the new visitor journey view?
It's a new section in your help center stats that follows the path each visitor takes: where they landed, what they searched, which articles they read, and whether they solved it themselves or contacted your team. It shows both the big-picture funnel and individual session timelines, so you can see exactly where your help center helps people and where it loses them.
What is a self-service resolution rate and where do I find it?
It's the share of visitors who found their answer and left without contacting support. You'll find it at the top of the Journeys section, stated as a percentage alongside the share who went on to contact you. It's the quickest read on how well your help center is doing its core job.
Why did my visitor numbers drop after the update?
Because the old system counted bot and scraper traffic it couldn't reliably tell apart from real people, and the new one filters that out by default. Your real human traffic didn't fall. The way it's counted got more accurate, so the total looks lower and means more.
Why are my article views lower now?
The old system counted a view the moment a page loaded, even if someone bounced instantly. The new system only counts a read when the article is actually on screen and a real person is there with it. The total is smaller, but every read is a genuine one.
Did I lose data, or did my traffic actually go down?
Neither. Your help center is getting the same real visits it did before. What changed is what counts as a visit and a read. Think of it as a more accurate scale, not less weight. Don't compare old screenshots one-to-one against the new numbers.
What does HelpCenter.io collect about my visitors now?
The minimum needed for your report: that a visit happened, what was searched, which article was read, and roughly how long. It does not store raw IP addresses, set tracking cookies, collect names or emails from visitors, or share anything with third-party ad or analytics networks.
Do I need to turn any of this on?
No. It's part of your help center and rolls out automatically. If you're seeing the new dashboard, the journey view, and the insights panel, you're already on it.